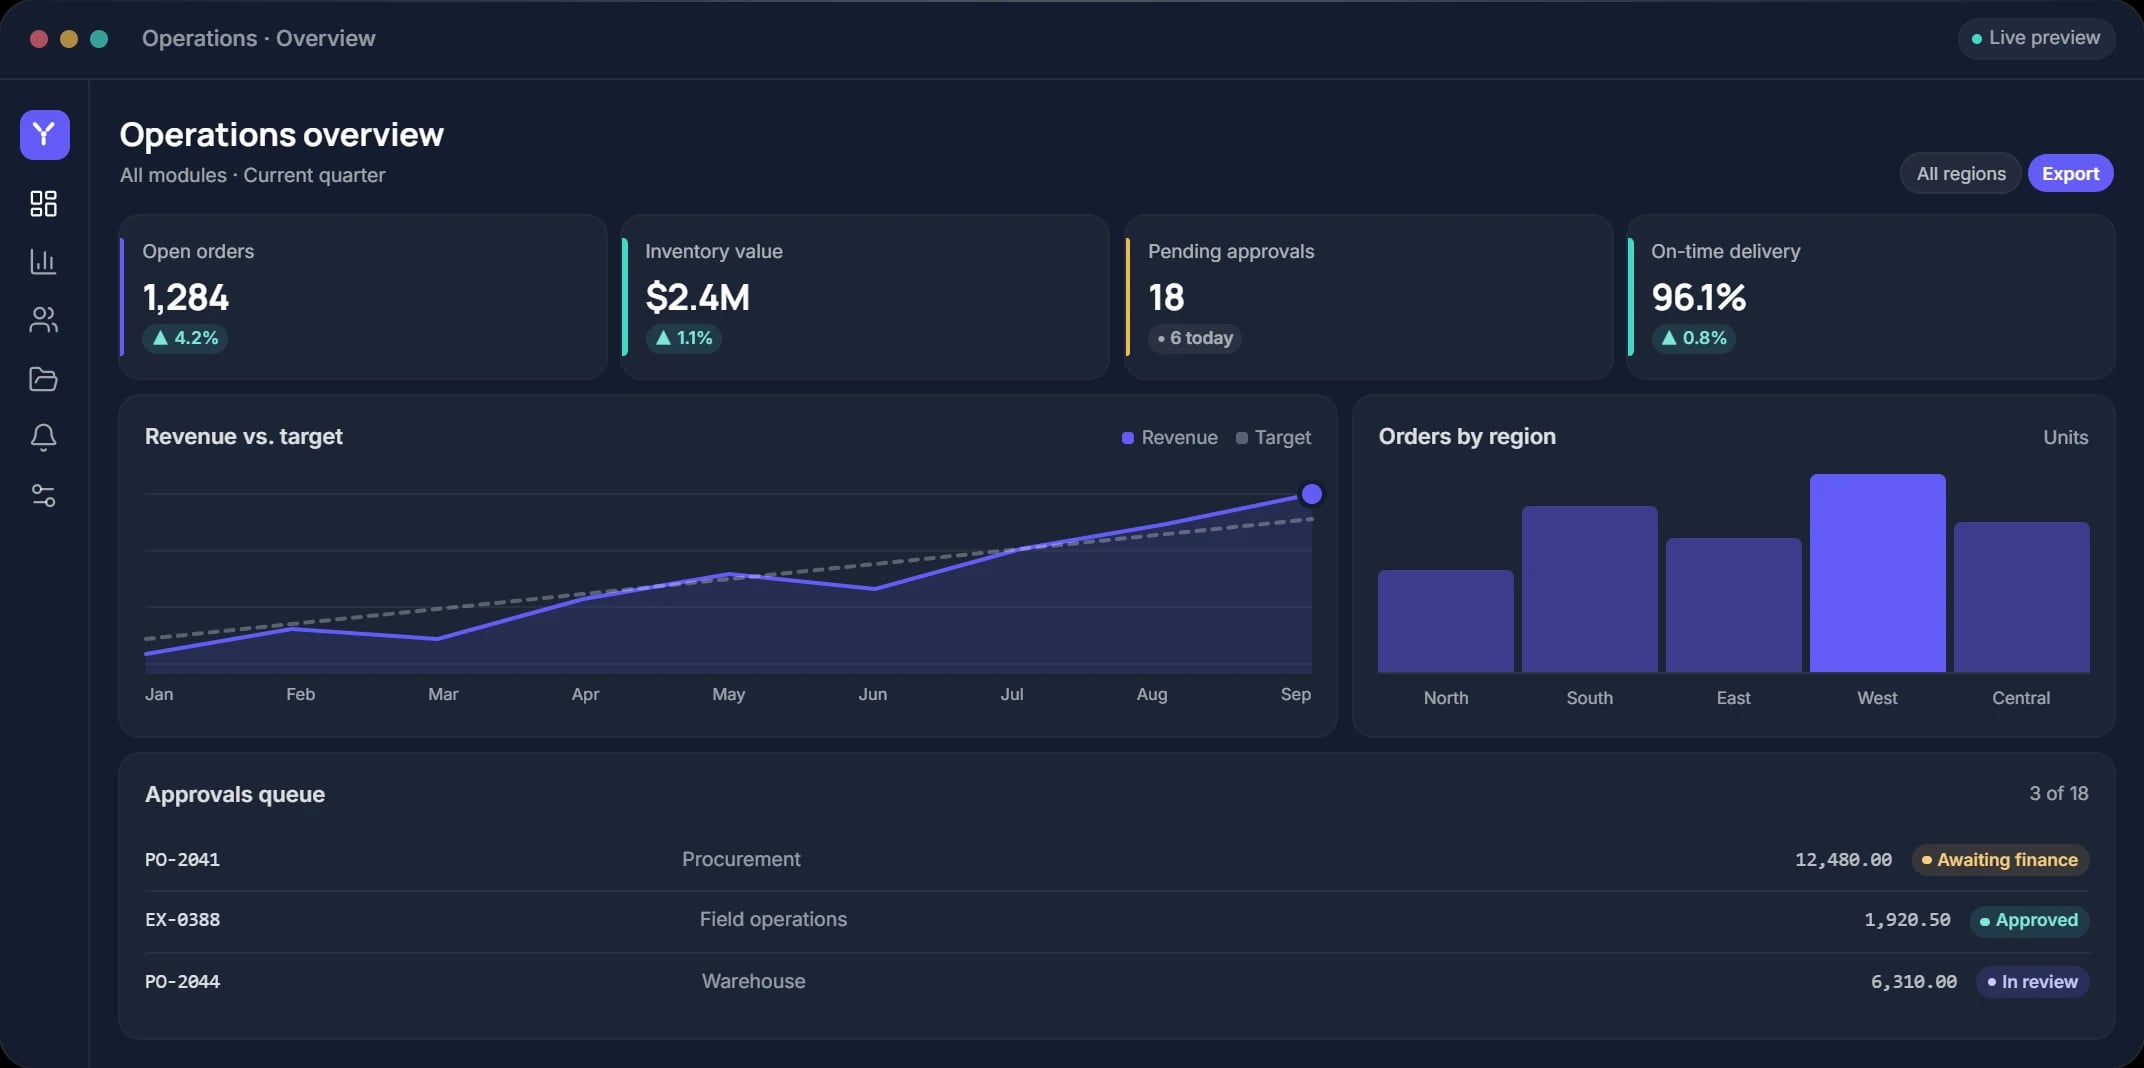
Concept project
Corporate Enterprises
Unified Operations ERP
A modular ERP bringing procurement, inventory, sales and finance into one system, with configurable approval workflows.
Next.jsTypeScriptSpring BootPostgreSQL
View case studyMost organizations have plenty of data and too little confidence in it. We consolidate data from scattered sources, model it for analysis and build dashboards that answer the questions leaders actually ask.
Data pipelines, warehouses and dashboards that give decision-makers one trusted version of the facts.
Centralized, well-modelled data stores optimized for reporting and analysis.
Automated pipelines that extract, clean and load data from your operational systems.
Interactive dashboards with clear indicators, filters and drill-down.
Power BI reports and data models, from design through governance and sharing.
Custom charts and visual analytics where standard BI tools fall short.
Processing large or high-frequency datasets with scalable analytical tools.
Schema design, performance tuning and governance for transactional and analytical databases.
Consolidate figures from multiple systems so every report agrees.
Follow operational and strategic indicators as close to real time as you need.
Produce consistent, accurate reports for boards, donors and regulators.
Detect and fix incomplete, duplicate or inconsistent records at the source.
Data models are designed around the questions people need answered.
Every indicator has a clear definition, owner and calculation.
Pipelines validate data on every run, so issues surface early.
Concept projects that illustrate how this service comes together in a complete solution.
A modular ERP bringing procurement, inventory, sales and finance into one system, with configurable approval workflows.
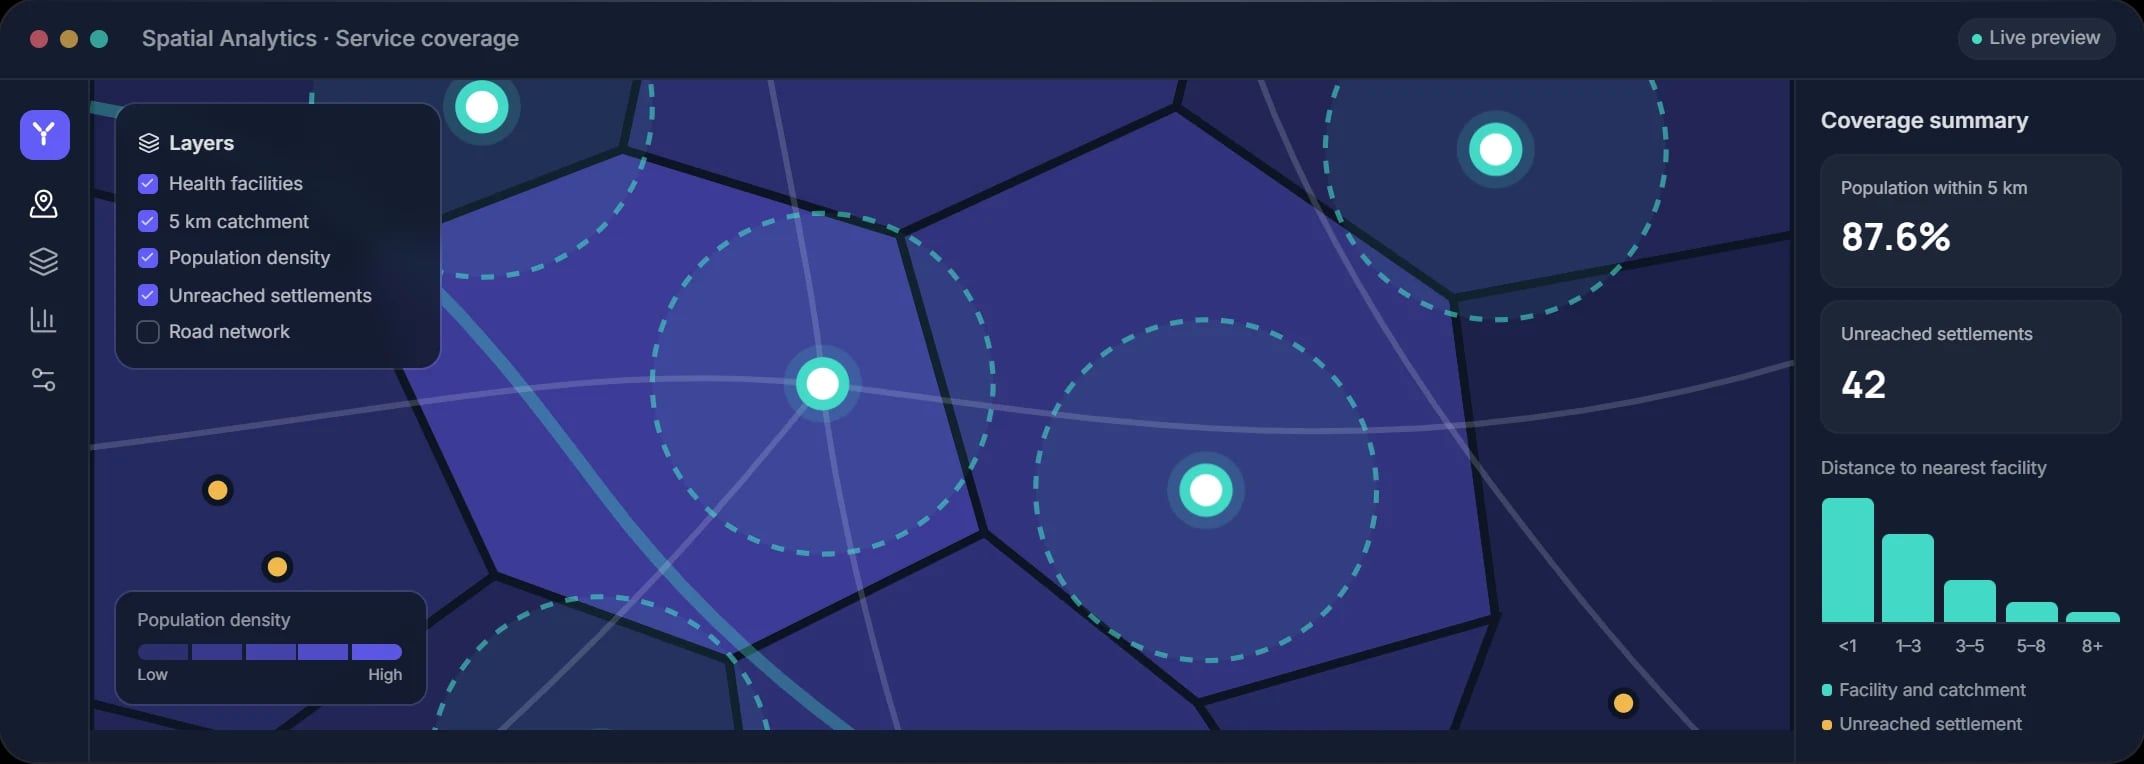
A platform that maps field survey data as it arrives and analyzes coverage, gaps and hotspots across program areas.
Tell us what you want to achieve with Data & BI. We will review your goals and suggest a practical way forward.